Aquaponics Post #3
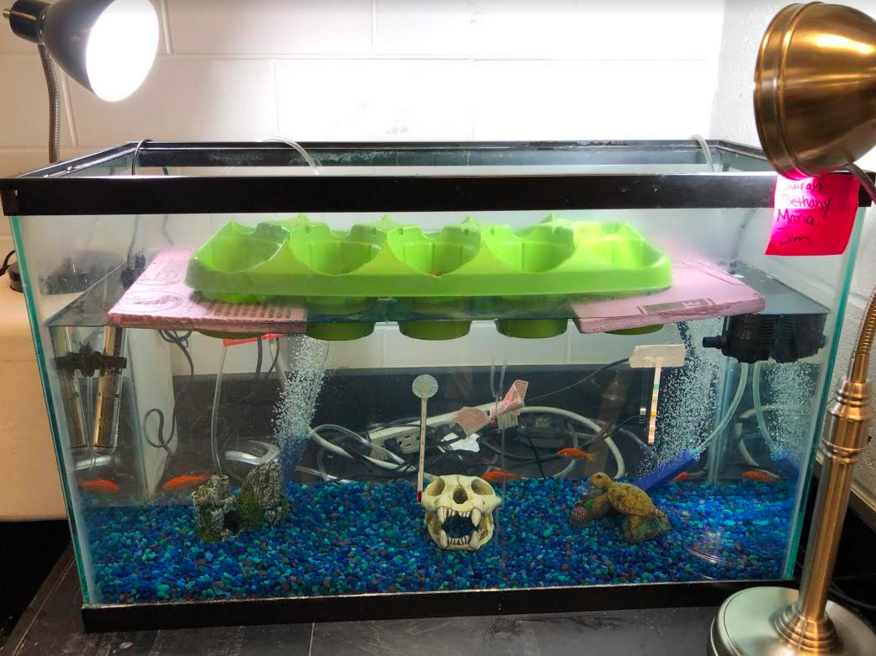
1. The purpose of our experiment is to investigate which plant (Ocimum basilicum or Mentha piperita) has a higher growth rate in an aquaponics system driven by Carassius auratus (goldfish). The experiment will show which species of plant grows more with the same resources.
2. When placed in an aquaponics system, peppermint will have a higher rate of primary productivity than basil. This is because mint “grows like a weed nearly everywhere it’s planted.” Mint is an easy plant for aquaponics systems because it grows quickly without much help. Basil, however, is on the other end of the spectrum. While basil can grow in a range of pH levels, it requires warm temperatures and pruning for optimal growth.
Storey, A. (2016, September 30). How to Grow Mint in Hydroponics - All You Need to Know. Retrieved from https://university.upstartfarmers.com/blog/how-to-grow-mint
Storey, A. (2016, December 22). Growing Basil in Hydroponics? Read This First. Retrieved from https://university.upstartfarmers.com/blog/growing-basil-in-hydroponics-read-this-first
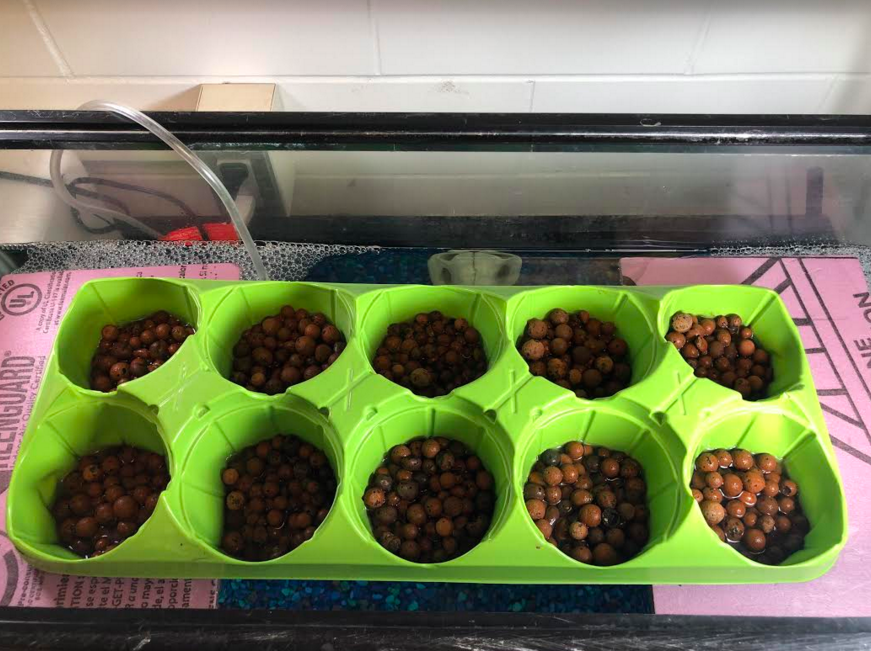
3. We will observe and record (with pictures) the welfare of the plants by analyzing their color and structural integrity. Also, we will be sure to record (in a data table) the health of the fish by taking note of their eating habits and swimming patterns.
4. In a data table, we will record the pH of the water and presence of ammonia by comparing colors of test strips to a pH scale and ammonia scale. Also, in a table, we will measure and record the average number of leaves, average leaf width, and average leaf length for each of the plant species (we will add up the measurements, and divide by the number of measurements taken) in order to calculate the average growth rate.
5. We will test the pH and ammonia weekly to account for any changes that might harm our fish. In addition, we will collect data from our plants twice a week after germination (on Mondays and Fridays). We will use this data to calculate average growth rate once every two weeks after germination.
6. We will record our data in three ways. First, we will create a chart for the growth rate of the leaves. In the chart, we will record average number of leaves, average leaf width, and average leaf length for each of the plant species. Once every two weeks after germination, we will calculate the average growth rate of the two plants using the information from our table. At the very end of our experiment, we will calculate another average growth rate to compare this data to the bi-weekly growth grates. At the end of our experiment, we will create a line graph to visualize the growth rates over time. Finally, we will post pictures to our website every two weeks for visual data.
7. We will document our progress to the scientific community by posting our data every two weeks to our website (under the data tab).
8. We will report our final data to the scientific community by compiling each of the species’ bi-weekly growth rates into a line graph, posting pictures of the progression of our experiment, and presenting our data tables on our website (under the data tab).
9. Our experiment would be a success if, at the end, the goldfish served their purpose of providing nutrients to the plants and if the plants served their purpose of filtering the water for the goldfish. In short, our experiment will be a success if our plants grow and if our fish don’t die. We will also be successful if we are able to gather sufficient data from our aquaponics system and relate it to the free energy of that system.
10.
2. When placed in an aquaponics system, peppermint will have a higher rate of primary productivity than basil. This is because mint “grows like a weed nearly everywhere it’s planted.” Mint is an easy plant for aquaponics systems because it grows quickly without much help. Basil, however, is on the other end of the spectrum. While basil can grow in a range of pH levels, it requires warm temperatures and pruning for optimal growth.
Storey, A. (2016, September 30). How to Grow Mint in Hydroponics - All You Need to Know. Retrieved from https://university.upstartfarmers.com/blog/how-to-grow-mint
Storey, A. (2016, December 22). Growing Basil in Hydroponics? Read This First. Retrieved from https://university.upstartfarmers.com/blog/growing-basil-in-hydroponics-read-this-first
3. We will observe and record (with pictures) the welfare of the plants by analyzing their color and structural integrity. Also, we will be sure to record (in a data table) the health of the fish by taking note of their eating habits and swimming patterns.
4. In a data table, we will record the pH of the water and presence of ammonia by comparing colors of test strips to a pH scale and ammonia scale. Also, in a table, we will measure and record the average number of leaves, average leaf width, and average leaf length for each of the plant species (we will add up the measurements, and divide by the number of measurements taken) in order to calculate the average growth rate.
5. We will test the pH and ammonia weekly to account for any changes that might harm our fish. In addition, we will collect data from our plants twice a week after germination (on Mondays and Fridays). We will use this data to calculate average growth rate once every two weeks after germination.
6. We will record our data in three ways. First, we will create a chart for the growth rate of the leaves. In the chart, we will record average number of leaves, average leaf width, and average leaf length for each of the plant species. Once every two weeks after germination, we will calculate the average growth rate of the two plants using the information from our table. At the very end of our experiment, we will calculate another average growth rate to compare this data to the bi-weekly growth grates. At the end of our experiment, we will create a line graph to visualize the growth rates over time. Finally, we will post pictures to our website every two weeks for visual data.
7. We will document our progress to the scientific community by posting our data every two weeks to our website (under the data tab).
8. We will report our final data to the scientific community by compiling each of the species’ bi-weekly growth rates into a line graph, posting pictures of the progression of our experiment, and presenting our data tables on our website (under the data tab).
9. Our experiment would be a success if, at the end, the goldfish served their purpose of providing nutrients to the plants and if the plants served their purpose of filtering the water for the goldfish. In short, our experiment will be a success if our plants grow and if our fish don’t die. We will also be successful if we are able to gather sufficient data from our aquaponics system and relate it to the free energy of that system.
10.
|
|
